
The annual SEVIS by the Numbers report by US Immigration and Customs Enforcement (ICE) is fresh off the press. In last year’s breakdown, we highlighted that the downward trend in the US’s international education sector was slowing. We’re excited to see that the trend officially reversed in 2022: The US recorded its most active F-1 and M-1 students since 2019.
All US regions grew in 2022, but which ones grew the most? How did the top source markets shift? And what were the most popular higher education majors? We’ll answer these questions and more as we dive into the sector’s impressive rebound.
Key Insights at a Glance
- All four US Census regions grew by at least 8% in 2022 compared to the previous year.1
- Overall, the US saw student gains from Africa (+17.1%), Asia (+12.4%), Europe (+17.3%), and Latin America (+17%).
- The US hosted over 20,700 Colombian students in 2022, an increase of 39.8% over the previous year.
- Over 91,000 international students pursued computer science, the top primary major in 2022.
Growth in All Four US Census Regions in 2022
The US hosted over 1.3 million F-1 and M-1 students in 2022, an increase of 10% over the previous year. What were the most popular US regions for these students? The map below shows the shift in active students in each US Census region last year:
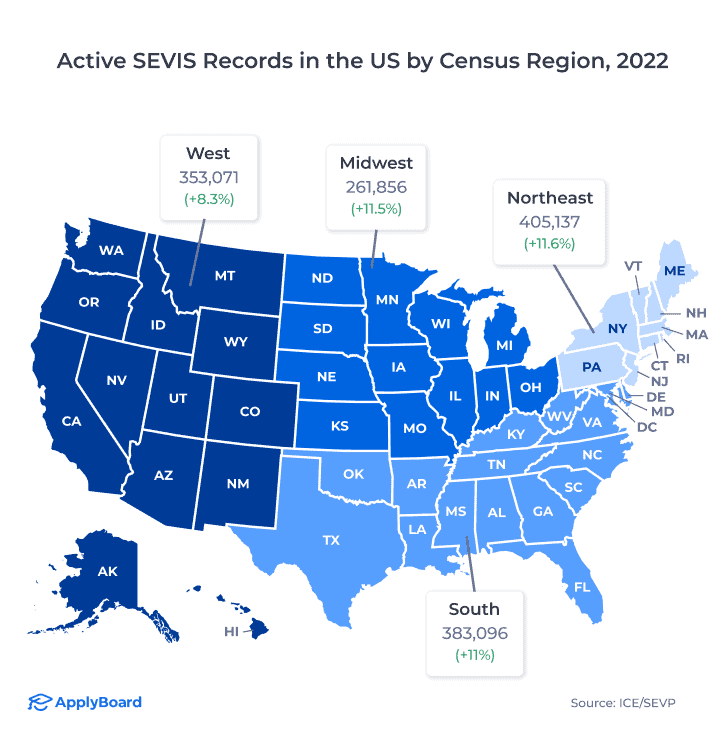
All four US regions grew in 2022 compared to the previous year. In fact, each region grew by at least 8% over this period.
The Northeast had the largest growth of all regions in 2022, and was the first to surpass 405,000 active students since 2019. New York was the most popular state in the region, hosting over 156,000 international students last year. This represented a growth of 10.1% compared to 2021.
Although the Midwest continued to host fewer students than any other region in 2022, its year-over-year growth rate of 11.5% nearly matched the Northeast’s. Illinois, the region’s most popular state, grew by 15.7% in 2022 compared to the previous year, surpassing 67,000 active students.
The number of international students in the South increased by 11% in 2022 over the previous year. Texas led the way, growing by 16.5% over this period to host over 102,000 international students.
The West, up 8.3% in 2022 over the previous year, was the only region with a growth rate below 11%. However, California hosted more than 225,000 active students in 2022, more than any other US state. The Golden State grew by 8.1% over the previous year.
The chart below allows you to see the top three percentage changes by state for each region in 2022. Highlighting an individual bar will show you the overall change in active students:
Top 10 Student Markets in the US in 2022
8 of the US’s top 10 source markets grew in 2022. The table below shows how these markets shifted over the past year:
The gap between China and India continued to narrow in 2022. Of the top 10 source markets, China was one of only two with a declining student population. The Indian student population, on the other hand, grew by a whopping 64,300 last year, an increase of over 27%. But with China ending its zero-COVID policy at the end of 2022, the US’s education sector could see an influx of renewed Chinese student interest in 2023.
China accounted for 23.8% of all active students in the US in 2022, while India accounted for 21.8%.
Overall, the US saw student gains from Africa (+17.1%), Asia (+12.4%), Europe (+17.3%), and Latin America (+17%). In last year’s SEVIS breakdown, we highlighted Nigeria as a country worth monitoring. And that proved true, as Nigeria continued its upward trend in 2022, growing by 18.6% and knocking out Mexico as a top 10 student market in the US.
So what country should the sector pay attention to in 2023? Colombia. The US hosted over 20,700 Colombian students in 2022, an increase of 39.8% over the previous year. This was the largest growth rate among Latin American countries. With the Saudi Arabian student population continuing to trend downward, don’t be surprised to see Colombia take its place as a top 10 source market.
What Did Students Pursue in the US in 2022?
Our partners frequently want to know what programs students are pursuing. The table below shows the top 10 primary majors by active student count in 2022:
Half of all active students in the US studied at least one of the top 20 majors in 2022. This was an increase of one percentage point compared to the previous year.
17 of these programs grew in 2022 over 2021. Over this period, computer science and second language learning grew by a momentous 21.8% and 35.1%, respectively. This growth was enough to knock business administration and management out of the top spot for the first time since 2019. Over 91,000 international students pursued computer science last year.
The US hosted only 7,076 international students in registered nursing in 2022, a field facing significant worker shortages.
Looking Ahead
2022 was a fantastic turnaround for the US’s international education sector. Active student numbers were up nearly across the board. And it could be a sign of great things to come in 2023, with student visa wait times generally improving.
At the same time, the US faces more competition to attract international students than ever before. US institutions could separate themselves from their competitors by aligning with sectors facing worker shortages. Post-graduation work opportunities are a top student concern. And the institutions that are most likely to grow in the future are those that can integrate working opportunities and soft skills development into their offerings for students.
At ApplyBoard, we look forward to working with our partner institutions to continue helping educate the world.
Subscribe to ApplyInsights
Sign up for the latest insights on international education.
![]()
About the ApplyInsights Team
FOOTNOTES:
1. All data courtesy of the US Immigration and Customs Enforcement Student and Exchange Visitor Program (SEVP), unless otherwise noted.